Custom RSI & MACD Momentum Entry SignalsIndicator Explanation: Custom RSI & MACD Momentum Entry Signals
Introduction
The "Custom RSI & MACD Momentum Entry Signals" indicator combines the Relative Strength Index (RSI) and the Moving Average Convergence Divergence (MACD) to generate precise long and short entry signals. This indicator offers a powerful combination of overbought/oversold zones, momentum analysis, and RSI-EMA crossovers to assist traders in making better decisions.
How the Indicator Works
1. RSI Calculation and EMA
The RSI is calculated based on the closing price with an adjustable period (default: 14).
An Exponential Moving Average (EMA) of the RSI (default: 9) is plotted to identify RSI trend changes.
When the RSI crosses its EMA upwards, it signals a bullish impulse. Conversely, a downward cross indicates a bearish impulse.
2. MACD Calculation and Momentum Shifts
The MACD line is derived from the difference between a fast EMA (default: 12) and a slow EMA (default: 26).
The Signal line is the EMA of the MACD line (default: 9).
The MACD histogram represents the difference between the MACD line and the Signal line.
Momentum shifts are detected as follows:
Weakening Bearish: Histogram is negative but increasing (less bearish pressure).
Strengthening Bullish: Histogram is positive and rising.
Weakening Bullish: Histogram is positive but decreasing.
Strengthening Bearish: Histogram is negative and falling.
Signal Generation
Long Signals
A Long signal is triggered when all of the following conditions are met:
The RSI was previously below 30 (oversold condition).
MACD momentum shifts from "strengthening bearish" to "weakening bearish" or turns bullish.
The RSI crosses its EMA upwards.
A green upward arrow is displayed below the bar, and the background is lightly shaded green for additional visualization.
Short Signals
A Short signal is triggered when all of the following conditions are met:
The RSI was previously above 70 (overbought condition).
MACD momentum shifts from "strengthening bullish" to "weakening bullish" or turns bearish.
The RSI crosses its EMA downwards.
A red downward arrow is displayed above the bar, and the background is lightly shaded red for additional visualization.
Visual Elements
RSI and EMA:
The RSI is shown in purple.
The RSI EMA is shown in blue.
Horizontal lines at 30 (oversold) and 70 (overbought) provide additional context.
MACD:
The MACD line is displayed in blue.
The Signal line is displayed in orange.
The zero line is added for easier interpretation.
Signals:
Green arrows: Long signals.
Red arrows: Short signals.
Background color: Light green for long conditions, light red for short conditions.
Use Cases
This indicator is ideal for:
Trend Followers: Combining RSI and MACD allows traders to identify entry points during impulsive trend shifts.
Swing Traders: Long and short signals can be used at reversal points to capture short-term price movements.
Momentum Traders: By considering MACD momentum, the indicator provides additional confidence in signal generation.
Customizable Settings
The indicator provides flexible input options:
RSI Period (default: 14)
RSI EMA Period (default: 9)
MACD Parameters: Fast, slow, and signal EMAs can be adjusted.
Conclusion
The Custom RSI & MACD Momentum Entry Signals indicator is a powerful tool for traders looking to combine RSI and MACD to identify high-probability entry signals. With clear visualization and precise signal generation, traders can make decisions more efficiently and capitalize on market movements.
Komut dosyalarını "relative strength" için ara

RSI and Bollinger Bands Screener [deepakks444]Indicator Overview
The indicator is designed to help traders identify potential long signals by combining the Relative Strength Index (RSI) and Bollinger Bands across multiple timeframes. This combination allows traders to leverage the strengths of both indicators to make more informed trading decisions.
Understanding RSI
What is RSI?
The Relative Strength Index (RSI) is a momentum oscillator that measures the speed and change of price movements. Developed by J. Welles Wilder Jr. for stocks and forex trading, the RSI is primarily used to identify overbought or oversold conditions in an asset.
How RSI Works:
Calculation: The RSI is calculated using the average gains and losses over a specified period, typically 14 periods.
Range: The RSI oscillates between 0 and 100.
Interpretation:
Key Features of RSI:
Momentum Indicator: RSI helps identify the momentum of price movements.
Divergences: RSI can show divergences, where the price makes a higher high, but the RSI makes a lower high, indicating potential reversals.
Trend Identification: RSI can also help identify trends. In an uptrend, the RSI tends to stay above 50, and in a downtrend, it tends to stay below 50.
Understanding Bollinger Bands
What is Bollinger Bands?
Bollinger Bands are a type of trading band or envelope plotted two standard deviations (positively and negatively) away from a simple moving average (SMA) of a price. Developed by financial analyst John Bollinger, Bollinger Bands consist of three lines:
Upper Band: SMA + (Standard Deviation × Multiplier)
Middle Band (Basis): SMA
Lower Band: SMA - (Standard Deviation × Multiplier)
How Bollinger Bands Work:
Volatility Measure: Bollinger Bands measure the volatility of the market. When the bands are wide, it indicates high volatility, and when the bands are narrow, it indicates low volatility.
Price Movement: The price tends to revert to the mean (middle band) after touching the upper or lower bands.
Support and Resistance: The upper and lower bands can act as dynamic support and resistance levels.
Key Features of Bollinger Bands:
Volatility Indicator: Bollinger Bands help traders understand the volatility of the market.
Mean Reversion: Prices tend to revert to the mean (middle band) after touching the bands.
Squeeze: A Bollinger Band Squeeze occurs when the bands narrow significantly, indicating low volatility and a potential breakout.
Combining RSI and Bollinger Bands
Strategy Overview:
The strategy aims to identify potential long signals by combining RSI and Bollinger Bands across multiple timeframes. The key conditions are:
RSI Crossing Above 60: The RSI should cross above 60 on the 15-minute timeframe.
RSI Above 60 on Higher Timeframes: The RSI should already be above 60 on the hourly and daily timeframes.
Price Above 20MA or Walking on Upper Bollinger Band: The price should be above the 20-period moving average of the Bollinger Bands or walking on the upper Bollinger Band.
Strategy Details:
RSI Calculation:
Calculate the RSI for the 15-minute, 1-hour, and 1-day timeframes.
Check if the RSI crosses above 60 on the 15-minute timeframe.
Ensure the RSI is above 60 on the 1-hour and 1-day timeframes.
Bollinger Bands Calculation:
Calculate the Bollinger Bands using a 20-period moving average and 2 standard deviations.
Check if the price is above the 20-period moving average or walking on the upper Bollinger Band.
Entry and Exit Signals:
Long Signal: When all the above conditions are met, consider a long entry.
Exit: Exit the trade when the price crosses below the 20-period moving average or the stop-loss is hit.
Example Usage
Setup:
Add the indicator to your TradingView chart.
Configure the inputs as per your requirements.
Monitoring:
Look for the long signal on the chart.
Ensure that the RSI is above 60 on the 15-minute, 1-hour, and 1-day timeframes.
Check that the price is above the 20-period moving average or walking on the upper Bollinger Band.
Trading:
Enter a long position when the criteria are met.
Set a stop-loss below the low of the recent 15-minute candle or based on your risk management rules.
Monitor the trade and exit when the RSI returns below 60 on any of the timeframes or when the price crosses below the 20-period moving average.
House Rules Compliance
No Financial Advice: This strategy is for educational purposes only and should not be construed as financial advice.
Risk Management: Always use proper risk management techniques, including stop-loss orders and position sizing.
Past Performance: Past performance is not indicative of future results. Always conduct your own research and analysis.
TradingView Guidelines: Ensure that any shared scripts or strategies comply with TradingView's terms of service and community guidelines.
Conclusion
This strategy combines RSI and Bollinger Bands across multiple timeframes to identify potential long signals. By ensuring that the RSI is above 60 on higher timeframes and that the price is above the 20-period moving average or walking on the upper Bollinger Band, traders can make more informed decisions. Always remember to conduct thorough research and use proper risk management techniques.

Kalman Synergy Oscillator (KSO)The Kalman Synergy Oscillator (KSO) is an innovative technical indicator that combines the Kalman filter with two well-established momentum oscillators: the Relative Strength Index (RSI) and Williams %R. This combination aims to provide traders with a more refined tool for market analysis.
The use of the Kalman filter is a key feature of the KSO. This sophisticated algorithm is known for its ability to extract meaningful signals from noisy data. In financial markets, this translates to smoothing out price action while maintaining responsiveness to genuine market movements. By applying the Kalman filter to price data before calculating the RSI and Williams %R, the KSO potentially offers more stable and reliable signals.
The synergy between the Kalman-filtered price data and the two momentum indicators creates an oscillator that attempts to capture market dynamics more effectively. The RSI contributes its strength in measuring the magnitude and speed of price movements, while Williams %R adds sensitivity to overbought and oversold conditions. Basing these calculations on Kalman-filtered data may help reduce false signals and provide a clearer picture of underlying market trends.
A notable aspect of the KSO is its dynamic weighting system. This approach adjusts the relative importance of the RSI and Williams %R based on their current strengths, allowing the indicator to emphasize the most relevant information as market conditions change. This flexibility, combined with the noise-reduction properties of the Kalman filter, positions the KSO as a potentially useful tool for different market conditions.
In practice, traders might find that the KSO offers several potential benefits:
Smoother oscillator movements, which could aid in trend identification and reversal detection.
Possibly reduced whipsaws, particularly in choppy or volatile markets.
Potential for improved divergence detection, which might lead to more timely reversal signals.
Consistent performance across different timeframes, due to the adaptive nature of the Kalman filter.
While the KSO builds upon existing concepts in technical analysis, its integration of the Kalman filter with traditional momentum indicators offers traders an interesting tool for market analysis. It represents an attempt to address common challenges in technical analysis, such as noise reduction and false signal minimization.
As with any technical indicator, the KSO should be used as part of a broader trading strategy rather than in isolation. Its effectiveness will depend on how well it aligns with a trader's individual approach and market conditions. For traders looking to explore a more refined momentum oscillator, the Kalman Synergy Oscillator could be a worthwhile addition to their analytical toolkit.

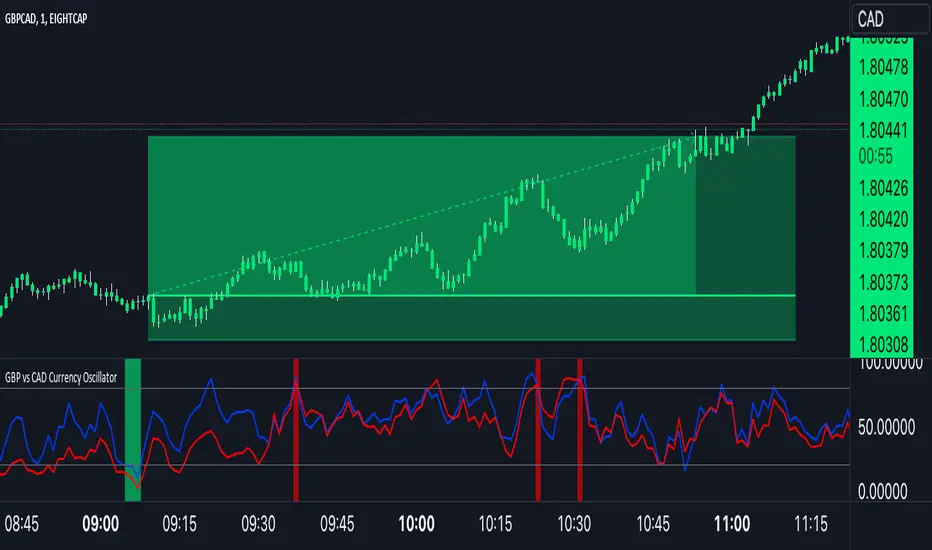
GBP Index vs CAD Index Currency OscillatorGBP vs CAD Currency Oscillator
This custom oscillator compares the relative strength of GBP (British Pound) and CAD (Canadian Dollar) against a basket of other currencies to determine potential overbought and oversold conditions. The indicator is designed to help traders evaluate momentum shifts and identify possible trend reversals between these two currencies, not just the GBPCAD pair.
How it Works:
Currency Index Calculation:
The oscillator calculates the average percentage change in 7 key GBP pairs (GBPUSD, EURGBP, GBPJPY, GBPAUD, GBPNZD, GBPCAD, and GBPCHF).
Similarly, it calculates the average percentage change for 7 key CAD pairs (USDCAD, EURCAD, CADJPY, AUDCAD, NZDCAD, GBPCAD, and CADCHF).
Stochastic Oscillator:
The indicator calculates a 0-100 oscillator for both the GBP and CAD currency indices based on the highest high and lowest low over a user-defined lookback period (default is 14 anlthough 60 works great on 1m chart).
The oscillator is smoothed using a simple moving average (default smoothing period is 3) to reduce noise and improve visual clarity.
Overbought/Oversold Conditions:
Overbought: When both the GBP and CAD oscillators exceed 80, the background turns red, indicating potential overbought conditions.
Oversold: When both oscillators fall below 20, the background turns green, signaling possible oversold conditions.
Crossovers:
When the GBP oscillator crosses above the CAD oscillator, a green dot appears at the bottom of the chart, signaling potential GBP strength.
When the GBP oscillator crosses below the CAD oscillator, a red dot appears, signaling potential CAD strength.
How to Use:
Overbought/Oversold Conditions: Use the red and green background highlights to spot potential overbought or oversold market conditions, helping you identify possible turning points.
Customization Options:
Lookback Period: You can adjust the lookback period for the stochastic calculation, allowing for sensitivity tuning (default: 14).
Smoothing Period: Control the degree of smoothing applied to the oscillators (default: 3).
This oscillator is ideal for traders focused on trading GBP and CAD pairs, offering a comparative analysis that can assist in better decision-making based on relative currency strength.
Uptrick: Market MoodsThe "Uptrick: Market Moods" indicator is an advanced technical analysis tool designed for the TradingView platform. It combines three powerful indicators—Relative Strength Index (RSI), Average True Range (ATR), and Bollinger Bands—into one cohesive framework, aimed at helping traders better understand and interpret market sentiment. By capturing shifts in the emotional climate of the market, it provides a holistic view of market conditions, which can range from calm to stressed or even highly excited. This multi-dimensional analysis tool stands apart from traditional single-indicator approaches by offering a more complete picture of market dynamics, making it a valuable resource for traders looking to anticipate and react to changes in market behavior.
The RSI in the "Uptrick: Market Moods" indicator is used to measure momentum. RSI is an essential component of many technical analysis strategies, and in this tool, it is used to identify potential market extremes. When RSI values are high, they indicate an overbought condition, meaning the market may be approaching a peak. Conversely, low RSI values suggest an oversold condition, signaling that the market could be nearing a bottom. These extremes provide crucial clues about shifts in market sentiment, helping traders gauge whether the current emotional state of the market is likely to result in a reversal. This understanding is pivotal in predicting whether the market is transitioning from calm to stressed or from excited to overbought.
The Average True Range adds another layer to this analysis by offering insights into market volatility. Volatility is a key factor in understanding the mood of the market, as periods of high volatility often reflect high levels of excitement or stress, while low volatility typically indicates a calm, steady market. ATR is calculated based on the range of price movements over a given period, and the higher the value, the more volatile the market is. The "Uptrick: Market Moods" indicator uses ATR to dynamically gauge volatility levels, helping traders understand whether the market is currently moving in a way that aligns with its emotional mood. For example, an increase in ATR accompanied by an RSI value that indicates overbought conditions could suggest that the market is in a highly excited state, with the potential for either strong momentum continuation or a sharp reversal.
Bollinger Bands complement these tools by providing visual cues about price volatility and the range within which the market is likely to move. Bollinger Bands plot two standard deviations away from a simple moving average of the price. This banding technique helps traders visualize how far the price is likely to deviate from its average over a certain period. The "Uptrick: Market Moods" indicator uses Bollinger Bands to establish price boundaries and identify breakout conditions. When prices break above the upper band or below the lower band, it often signals that the market is either highly stressed or excited. This breakout condition serves as a visual representation of the market mood, alerting traders to moments when prices are moving beyond typical ranges and when significant emotional shifts are occurring in the market.
Technically, the "Uptrick: Market Moods" indicator has been developed using TradingView’s Pine Script language, a highly efficient language for building custom indicators. It employs functions like ta.rsi, ta.atr, and ta.sma to perform the necessary calculations. The use of these built-in functions ensures that the calculations are both accurate and efficient, allowing the indicator to operate in real-time without lagging, even in volatile market conditions. The ta.rsi function is used to compute the Relative Strength Index, while ta.atr calculates the Average True Range, and ta.sma is used to smooth out price data for the Bollinger Bands. These functions are applied dynamically within the script, allowing the "Uptrick: Market Moods" indicator to respond to changes in market conditions in real time.
The user interface of the "Uptrick: Market Moods" indicator is designed to provide a visually intuitive experience. The market mood is color-coded on the chart, making it easy for traders to identify whether the market is calm, stressed, or excited at a glance. This feature is especially useful for traders who need to make quick decisions in fast-moving markets. Additionally, the indicator includes an interactive table that updates in real-time, showing the most recent mood state and its frequency. This provides valuable statistical insights into market behavior over specific time frames, helping traders track the dominant emotional state of the market. Whether the market is in a prolonged calm state or rapidly transitioning through moods, this real-time feedback offers actionable data that can help traders adjust their strategies accordingly.
The RSI component of the "Uptrick: Market Moods" indicator helps detect the speed and direction of price movements, offering insight into whether the market is approaching extreme conditions. By providing signals based on overbought and oversold levels, the RSI helps traders decide whether to enter or exit positions. The ATR element acts as a volatility gauge, dynamically adjusting traders’ expectations in response to changes in market volatility. Meanwhile, the Bollinger Bands help identify trends and potential breakout conditions, serving as an additional confirmation tool that highlights when the price has moved beyond normal boundaries, indicating heightened market excitement or stress.
Despite the robust capabilities of the "Uptrick: Market Moods" indicator, it does have limitations. In markets affected by sudden shifts, such as those driven by major news events or external economic factors, the indicator’s performance may not always be reliable. These external factors can cause rapid mood swings that are difficult for any technical analysis tool to fully anticipate. Additionally, the indicator’s complexity may pose a learning curve for novice traders, particularly those who are unfamiliar with the concepts of RSI, ATR, and Bollinger Bands. However, with practice, traders can become proficient in using the tool to its full potential, leveraging the insights it provides to better navigate market shifts.
For traders seeking a deeper understanding of market sentiment, the "Uptrick: Market Moods" indicator is an invaluable resource. It is recommended for those dealing with medium to high volatility instruments, where understanding emotional shifts can offer a strategic advantage. While it can be used on its own, integrating it with other forms of analysis, such as fundamental analysis and additional technical indicators, can enhance its effectiveness. By confirming signals with other tools, traders can reduce the likelihood of false signals and improve their overall trading strategy.
To further enhance the accuracy of the "Uptrick: Market Moods" indicator, it can be integrated with volume-based tools like Volume Profile or On-Balance Volume (OBV). This combination allows traders to confirm the moods identified by the indicator with volume data, providing additional confirmation of market sentiment. For example, when the market is in an excited mood, an increase in trading volume could reinforce the reliability of that signal. Conversely, if the market is stressed but volume remains low, traders may want to proceed with caution. Using multiple indicators together creates a more comprehensive trading approach, helping traders better manage risk and make informed decisions based on multiple data points.
In conclusion, the "Uptrick: Market Moods" indicator is a powerful and unique addition to the suite of technical analysis tools available on TradingView. It provides traders with a multi-dimensional view of market sentiment by combining the analytical strengths of RSI, ATR, and Bollinger Bands into a single tool. Its ability to capture and interpret the emotional mood of the market makes it an essential tool for traders seeking to gain an edge in understanding market behavior. While the indicator has certain limitations, particularly in rapidly shifting markets, its ability to provide real-time insights into market sentiment is a valuable asset for traders of all experience levels. Used in conjunction with other tools and sound trading practices, the "Uptrick: Market Moods" indicator offers a comprehensive solution for navigating the complexities of financial markets.

Bullish/Bearish Sentiment Cycle Indicator Sentiment Cycle Indicator: Understanding Market Psychology Through Technical Analysis
Overview:
The Sentiment Cycle Indicator is a unique blend of multiple technical analysis tools designed to help traders visualize and capitalize on market sentiment shifts. This indicator combines RSI (Relative Strength Index), MACD (Moving Average Convergence Divergence), volume analysis, and sentiment cycle detection to provide actionable buy and sell signals. By monitoring the emotional stages that market participants go through—such as optimism, excitement, euphoria, anxiety, denial, panic, and depression—this indicator helps traders identify turning points in the market cycle.
Key Components and How They Work Together:
1. RSI (Relative Strength Index):
• The RSI is a momentum oscillator that measures the speed and change of price movements. In this indicator, the RSI is used to determine overbought or oversold conditions, which are then translated into signals for potential market sentiment shifts.
• Integration: The RSI provides the foundational layer to assess whether the market is generally bullish or bearish. When combined with MACD and volume analysis, it helps confirm the strength of a sentiment cycle phase.
2. MACD (Moving Average Convergence Divergence):
• MACD is a trend-following indicator that shows the relationship between two moving averages of a security’s price. It is used in this script to identify trend direction and momentum changes.
• Integration: MACD crossovers are aligned with RSI conditions to detect the shift between bullish and bearish market sentiments. The MACD’s ability to capture trend changes strengthens the identification of sentiment phases, such as “optimism” or “panic.”
3. Volume Analysis:
• Volume analysis is a critical component in understanding market sentiment. The indicator uses a moving average of volume to detect volume spikes, which often coincide with significant market moves or reversals.
• Integration: Volume spikes are used to gauge the intensity of sentiment changes. For example, high volume during a bullish or bearish sentiment phase is a strong confirmation of a market sentiment shift. This integration enhances the reliability of the buy and sell signals generated by the sentiment cycle logic.
4. Sentiment Cycles:
• The indicator identifies four main sentiment phases—Optimism, Excitement, Panic, and Depression—based on combinations of RSI, MACD, and volume data. These phases are visually represented on the chart through background color zones, allowing traders to see the prevailing market sentiment at a glance.
• Integration: The sentiment phases are determined by a combination of the RSI trend, MACD crossovers, and volume analysis. For example, a transition from “Panic” to “Optimism” is detected when the RSI recovers from oversold levels, MACD turns bullish, and volume spikes decrease. This comprehensive approach ensures that all signals are well-founded and based on multiple dimensions of market data.
5. Buy and Sell Signals:
• The buy and sell signals are generated based on crossovers and crossunders between sentiment phases. For example, a buy signal is triggered when the market moves from a “Depression” (oversold) phase to an “Optimism” phase. A sell signal is triggered when the market transitions from “Excitement” to “Panic.”
• Integration: These signals are refined by adding a minimum distance between consecutive signals to avoid noise and enhance the clarity of trading opportunities. This further ensures that signals are not generated too frequently, reducing the chance of false positives.
Justification for Combining These Components:
The combination of RSI, MACD, volume analysis, and sentiment detection into a single indicator offers a holistic approach to understanding market psychology. Here’s why this mashup is particularly effective:
• Comprehensive Sentiment Analysis: The integration of RSI and MACD provides a well-rounded view of both momentum and trend, while volume analysis adds a layer of intensity to confirm sentiment shifts.
• Reduced Noise and Enhanced Signal Quality: By using multiple indicators to filter signals, the indicator minimizes noise and reduces the likelihood of false signals. This is particularly beneficial for traders looking to capitalize on meaningful market turns rather than being whipsawed by minor fluctuations.
• Visual Clarity: The background color zones corresponding to different sentiment phases offer a clear, at-a-glance view of the market’s current state, allowing traders to make more informed decisions quickly.
• Unique Combination for Market Sentiment Detection: While many indicators focus on either trend, momentum, or volume independently, this mashup uniquely combines these elements to detect the market’s underlying emotional state, providing a more nuanced understanding of market behavior.
How to Use This Indicator:
• Buy Signal: Look for the green “Buy” label when the market transitions from a bearish sentiment (grey or red zones) to a bullish sentiment (green zone).
• Sell Signal: Look for the red “Sell” label when the market transitions from a bullish sentiment (blue zone) to a bearish sentiment (red or gray zones).
• Dynamic Background Zones: Use the background color zones to visually track the prevailing market sentiment phase and anticipate potential buy or sell signals.
Originality and Practical Application:
This indicator’s originality lies in its ability to seamlessly integrate multiple widely-used technical analysis tools (RSI, MACD, and Volume) into a single, comprehensive tool for detecting market sentiment shifts. By doing so, it provides traders with a practical, easy-to-use tool that adapts to various market conditions, making it suitable for both day trading and longer-term strategies.
Conclusion:
The “Sentiment Cycle Indicator” is designed to offer traders a powerful, unified approach to identifying market sentiment shifts. By combining momentum, trend, and volume analysis, it delivers a unique and efficient way to navigate the complexities of market psychology, ultimately providing traders with an edge in understanding and predicting market movements.

Pulse Oscillator [UAlgo]The "Pulse Oscillator " is a trading tool designed to capture market momentum and trend changes by combining the strengths of multiple well-known technical indicators. By integrating the RSI (Relative Strength Index), CCI (Commodity Channel Index), and Stochastic Oscillator, this indicator provides traders with a comprehensive view of market conditions, offering both trend filtering and precise buy/sell signals. The oscillator is customizable, allowing users to fine-tune its parameters to match different trading strategies and timeframes. With its built-in smoothing techniques and level adjustments, the Pulse Oscillator aims to be a reliable tool for both trend-following and counter-trend trading strategies.
🔶 Key Features
Multi-Indicator Integration: Combines RSI, CCI, and Stochastic Oscillator to create a weighted momentum oscillator.
Why Use Multi-Indicator Integration?
Script uses Multi-Indicator Integration to combine the strengths of different technical indicators—such as RSI, CCI, and Stochastic Oscillator—into a single tool. This approach helps to reduce the weaknesses of individual indicators, providing a more comprehensive and reliable analysis of market conditions. By integrating multiple indicators, we can generate more accurate signals, filter out noise, and enhance our trading decisions.
Customizable Parameters: Allows users to adjust weights, periods, and smoothing techniques, providing flexibility to adapt the indicator to various market conditions.
Trend Filtering Option: An optional trend filter is available to enhance the accuracy of buy and sell signals, reducing the risk of false signals in choppy markets.
Dynamic Levels: The indicator dynamically calculates multiple levels of support and resistance, adjusting to market conditions with customizable decay factors and offsets.
Visual Clarity: The indicator visually represents different levels and trends with color-coded plots and fills, making it easier for traders to interpret market conditions at a glance.
Alerts: Configurable alerts for buy and sell signals, as well as trend changes, enabling traders to stay informed of key market movements without constant monitoring.
🔶 Interpreting the Indicator
Buy Signal: A buy signal is generated when the Slow Line crosses under the Fast Line during an uptrend or when the trend filter is disabled. This indicates a potential bullish reversal or continuation of an upward trend.
Sell Signal: A sell signal occurs when the Slow Line crosses above the Fast Line during a downtrend or when the trend filter is disabled, signaling a potential bearish reversal or continuation of a downward trend.
Trend Change: The indicator detects trend changes when the Fast Line shifts from increasing to decreasing or vice versa, providing early warning of possible market reversals.
Dynamic Levels: The indicator calculates upper and lower levels based on the Fast Line's values. These levels can be used to identify overbought or oversold conditions and potential areas of support or resistance.
🔶 Disclaimer
Use with Caution: This indicator is provided for educational and informational purposes only and should not be considered as financial advice. Users should exercise caution and perform their own analysis before making trading decisions based on the indicator's signals.
Not Financial Advice: The information provided by this indicator does not constitute financial advice, and the creator (UAlgo) shall not be held responsible for any trading losses incurred as a result of using this indicator.
Backtesting Recommended: Traders are encouraged to backtest the indicator thoroughly on historical data before using it in live trading to assess its performance and suitability for their trading strategies.
Risk Management: Trading involves inherent risks, and users should implement proper risk management strategies, including but not limited to stop-loss orders and position sizing, to mitigate potential losses.
No Guarantees: The accuracy and reliability of the indicator's signals cannot be guaranteed, as they are based on historical price data and past performance may not be indicative of future results.

RSI & ADX Controlled Entry Signals[deepakks444]Overview:
The "RSI & ADX Immediate Entry Signals" is a TradingView Pine Script designed to provide traders with timely entry signals based on two widely-used technical indicators: the Relative Strength Index (RSI) and the Average Directional Index (ADX). This script aims to maximize responsiveness to market conditions by generating buy and sell signals that reflect the current momentum and trend strength.
Key Components:
Relative Strength Index (RSI): The RSI is a momentum oscillator that measures the speed and change of price movements. It ranges from 0 to 100, typically identifying overbought conditions above 70 and oversold conditions below 30. This script utilizes an RSI threshold of 50 to determine bullish and bearish trends.
Average Directional Index (ADX): The ADX quantifies the strength of a trend without considering its direction. By setting a configurable threshold (default of 25), the script identifies strong trends in the market, facilitating entry signals based on trend direction.
Signal Generation:
Long Entry Signal: A buy signal is generated when the following conditions are met:
The +DI line (Positive Directional Indicator) is above the -DI line (Negative Directional Indicator).
The ADX exceeds the specified threshold (indicating trend strength).
The RSI is above 50 (indicating bullish momentum).
Short Entry Signal: A sell signal is triggered under these conditions:
The -DI line is above the +DI line.
The ADX exceeds the threshold.
The RSI is below 50 (indicating bearish momentum).
User Customization:
The script allows users to adjust the lengths for both the RSI and ADX calculations directly in the input settings to better suit their trading strategy and preferred timeframe.
Users can also customize the ADX threshold to modify sensitivity.
Benefits:
Responsiveness: This script eliminates lag and minimizes the potential for missed trading opportunities by providing immediate entry signals based on current market conditions.
Simplicity: Designed to assist traders in quickly identifying trend changes, this script makes it easy to visualize potential entry points without complex calculations.
Conclusion:
The "RSI & ADX Immediate Entry Signals" script is an effective tool for traders looking to add systematic, rules-based entry signals to their analysis. By combining momentum and trend strength indicators, this script enhances decision-making and can be easily integrated into larger trading strategies.
For immediate Buy/Sell signals keep ADX length at 3.

RSI with Bollinger Bands Scalp Startegy (1min)
------------------------------------------------------------------------------
The "RSI with Bollinger Bands Scalp Strategy (1min)" is a highly effective tool designed for traders who engage in short-term scalping on the 1-minute chart. This indicator combines the strengths of the RSI (Relative Strength Index) and Bollinger Bands to generate precise buy signals, helping traders make quick and informed decisions in fast-moving markets.
How It Works:
RSI (Relative Strength Index):
The RSI is a widely-used momentum oscillator that measures the speed and change of price movements. It operates on a scale of 0 to 100 and helps identify overbought and oversold conditions in the market.
This strategy allows customization of the RSI's lower and upper bands (default settings: 30 for the lower band and 70 for the upper band) and the RSI length (default: 14).
Bollinger Bands:
Bollinger Bands consist of a central moving average (the basis) and two bands that represent standard deviations above and below the basis. These bands expand and contract based on market volatility.
In this strategy, the Bollinger Bands are used to identify potential buy and sell signals based on the price's relationship to the upper and lower bands.
Signal Generation:
Buy Signal: A buy signal is triggered when two conditions are met:
The RSI value falls below the specified lower band, indicating an oversold condition.
The price crosses below the lower Bollinger Band.
The buy signal is then issued on the first positive candle (where the closing price is greater than or equal to the opening price) after these conditions are met.
Sell Signal: In this version of the strategy, the sell signal is currently disabled to focus solely on generating and optimizing the buy signals for scalping.
Strategy Highlights:
This indicator is particularly effective for traders who focus on 1-minute charts and want to capitalize on rapid price movements.
The combination of RSI and Bollinger Bands ensures that buy signals are only generated during significant oversold conditions, helping to filter out false signals.
Customization:
Users can adjust the RSI length, Bollinger Bands length, and the standard deviation multiplier to better fit their specific trading style and the asset they are trading.
The moving average type for Bollinger Bands can be selected from various options, including SMA, EMA, SMMA, WMA, and VWMA, allowing further customization based on individual preferences.
Usage:
Use this indicator on a 1-minute chart to identify potential buy opportunities during short-term price dips.
Since the sell signals are disabled, this strategy is best used in conjunction with other indicators or strategies to manage exit points effectively.
This "RSI with Bollinger Bands Scalp Strategy (1min)" indicator is a valuable tool for traders looking to enhance their short-term trading performance by focusing on high-probability entry points in volatile market conditions.

Uptrick: Dynamic AMA RSI Indicator### **Uptrick: Dynamic AMA RSI Indicator**
**Overview:**
The **Uptrick: Dynamic AMA RSI Indicator** is an advanced technical analysis tool designed for traders who seek to optimize their trading strategies by combining adaptive moving averages with the Relative Strength Index (RSI). This indicator dynamically adjusts to market conditions, offering a nuanced approach to trend detection and momentum analysis. By leveraging the Adaptive Moving Average (AMA) and Fast Adaptive Moving Average (FAMA), along with RSI-based overbought and oversold signals, traders can better identify entry and exit points with higher precision and reduced noise.
**Key Components:**
1. **Source Input:**
- The source input is the price data that forms the basis of all calculations. Typically set to the closing price, traders can customize this to other price metrics such as open, high, low, or even the output of another indicator. This flexibility allows the **Uptrick** indicator to be tailored to a wide range of trading strategies.
2. **Adaptive Moving Average (AMA):**
- The AMA is a moving average that adapts its sensitivity based on the dominant market cycle. This adaptation allows the AMA to respond swiftly to significant price movements while smoothing out minor fluctuations, making it particularly effective in trending markets. The AMA adjusts its responsiveness dynamically using a calculated phase adjustment from the dominant cycle, ensuring it remains responsive to the current market environment without being overly reactive to market noise.
3. **Fast Adaptive Moving Average (FAMA):**
- The FAMA is a more sensitive version of the AMA, designed to react faster to price changes. It serves as a signal line in the crossover strategy, highlighting shorter-term trends. The interaction between the AMA and FAMA forms the core of the signal generation, with crossovers between these lines indicating potential buy or sell opportunities.
4. **Relative Strength Index (RSI):**
- The RSI is a momentum oscillator that measures the speed and change of price movements, providing insights into whether an asset is overbought or oversold. In the **Uptrick** indicator, the RSI is used to confirm the validity of crossover signals between the AMA and FAMA, adding an additional layer of reliability to the trading signals.
**Indicator Logic:**
1. **Dominant Cycle Calculation:**
- The indicator starts by calculating the dominant market cycle using a smoothed price series. This involves applying exponential moving averages to a series of price differences, extracting cycle components, and determining the instantaneous phase of the cycle. This phase is then adjusted to provide a phase adjustment factor, which plays a critical role in determining the adaptive alpha.
2. **Adaptive Alpha Calculation:**
- The adaptive alpha, a key feature of the AMA, is computed based on the fast and slow limits set by the trader. This alpha is clamped within these limits to ensure the AMA remains appropriately sensitive to market conditions. The dynamic adjustment of alpha allows the AMA to be highly responsive in volatile markets and more conservative in stable markets.
3. **Crossover Detection:**
- The indicator generates trading signals based on crossovers between the AMA and FAMA:
- **CrossUp:** When the AMA crosses above the FAMA, it indicates a potential bullish trend, suggesting a buy opportunity.
- **CrossDown:** When the AMA crosses below the FAMA, it signals a potential bearish trend, indicating a sell opportunity.
4. **RSI Confirmation:**
- To enhance the reliability of these crossover signals, the indicator uses the RSI to confirm overbought and oversold conditions:
- **Buy Signal:** A buy signal is generated only when the AMA crosses above the FAMA and the RSI confirms an oversold condition, ensuring that the signal aligns with a momentum reversal from a low point.
- **Sell Signal:** A sell signal is triggered when the AMA crosses below the FAMA and the RSI confirms an overbought condition, indicating a momentum reversal from a high point.
5. **Signal Management:**
- To prevent signal redundancy during strong trends, the indicator tracks the last generated signal (buy or sell) and ensures that the next signal is only issued when there is a genuine reversal in trend direction.
6. **Signal Visualization:**
- **Buy Signals:** The indicator plots a "BUY" label below the bar when a buy signal is generated, using a green color to clearly mark the entry point.
- **Sell Signals:** A "SELL" label is plotted above the bar when a sell signal is detected, marked in red to indicate an exit or shorting opportunity.
- **Bar Coloring (Optional):** Traders have the option to enable bar coloring, where green bars indicate a bullish trend (AMA above FAMA) and red bars indicate a bearish trend (AMA below FAMA), providing a visual representation of the market’s direction.
**Customization Options:**
- **Source:** Traders can select the price data input that best suits their strategy (e.g., close, open, high, low, or custom indicators).
- **Fast Limit:** Adjustable sensitivity for the fast response of the AMA, allowing traders to tailor the indicator to different market conditions.
- **Slow Limit:** Sets the slower boundary for the AMA’s sensitivity, providing stability in less volatile markets.
- **RSI Length:** The period for the RSI calculation can be adjusted to fit different trading timeframes.
- **Overbought/Oversold Levels:** These thresholds can be customized to define the RSI levels that trigger buy or sell confirmations.
- **Enable Bar Colors:** Traders can choose whether to enable bar coloring based on the AMA/FAMA relationship, enhancing visual clarity.
**How Different Traders Can Use the Indicator:**
1. **Day Traders:**
- **Uptrick: Dynamic AMA RSI Indicator** is highly effective for day traders who need to make quick decisions in fast-moving markets. The adaptive nature of the AMA and FAMA allows the indicator to respond rapidly to intraday price swings. Day traders can use the buy and sell signals generated by the crossover and RSI confirmation to time their entries and exits with greater precision, minimizing exposure to false signals often prevalent in high-frequency trading environments.
2. **Swing Traders:**
- Swing traders can benefit from the indicator’s ability to identify and confirm trend reversals over several days or weeks. By adjusting the RSI length and sensitivity limits, swing traders can fine-tune the indicator to catch longer-term price movements, helping them to ride trends and maximize profits over medium-term trades. The dual confirmation of crossovers with RSI ensures that swing traders enter trades that have a higher probability of success.
3. **Position Traders:**
- For position traders who hold trades over longer periods, the **Uptrick** indicator offers a reliable method to stay in trades that align with the dominant trend while avoiding premature exits. By adjusting the slow limit and extending the RSI length, position traders can smooth out the indicator’s sensitivity, allowing them to focus on major market shifts rather than short-term volatility. The bar coloring feature also provides a clear visual indication of the overall trend, aiding in trade management decisions.
4. **Scalpers:**
- Scalpers, who seek to profit from small price movements, can use the fast responsiveness of the FAMA in conjunction with the RSI to identify micro-trends within larger market moves. The indicator’s ability to adapt quickly to changing conditions makes it a valuable tool for scalpers looking to execute numerous trades in a short period, capturing profits from minor price fluctuations while avoiding prolonged exposure.
5. **Algorithmic Traders:**
- Algorithmic traders can incorporate the **Uptrick** indicator into automated trading systems. The precise crossover signals combined with RSI confirmation provide clear and actionable rules that can be coded into algorithms. The adaptive nature of the indicator ensures that it can be used across different market conditions and timeframes, making it a versatile component of algorithmic strategies.
**Usage:**
The **Uptrick: Dynamic AMA RSI Indicator** is a versatile tool that can be integrated into various trading strategies, from short-term day trading to long-term investing. Its ability to adapt to changing market conditions and provide clear buy and sell signals makes it an invaluable asset for traders seeking to improve their trading performance. Whether used as a standalone indicator or in conjunction with other technical tools, **Uptrick** offers a dynamic approach to market analysis, helping traders to navigate the complexities of financial markets with greater confidence.
**Conclusion:**
The **Uptrick: Dynamic AMA RSI Indicator** offers a comprehensive and adaptable solution for traders across different styles and timeframes. By combining the strengths of adaptive moving averages with RSI confirmation, it delivers robust signals that help traders capitalize on market trends while minimizing the risk of false signals. This indicator is a powerful addition to any trader’s toolkit, enabling them to make informed decisions with greater precision and confidence. Whether you're a day trader, swing trader, or long-term investor, the **Uptrick** indicator can enhance your trading strategy and improve your market outcomes.

[TTI] Mike Webster Quick Break, QuickSand & Grateful Dead RS📜 ––––HISTORY & CREDITS–––
This TradingView script, " Mike Webster (Webby) Quick Break, Quicksand & Grateful Dead RS," is inspired by the trading methodology developed by Mike Webster. The concept was shared by Webster in a Twitter post, where he emphasized the strategy's role in managing a core position in a winning stock. Webster's approach is unique as it is based on Relative Strength (RS) line movements and their interaction with fast and slow moving averages. Credits go to Mike Webster for the foundational concept and to the script developer for adapting it into this practical tool.
🦄 –––UNIQUENESS–––
The uniqueness of this script lies in its innovative use of the Relative Strength line in conjunction with two distinct moving averages. It features three key stages:
"Quick Break," where the RS line crosses the fast-moving average;
"Quicksand," where the RS line moves lower than its level during the "Quick Break";
"Grateful Dead Break," where the RS line crosses the slow-moving average.
This approach offers a dynamic and nuanced method to manage positions in trending stocks. The indicator plots little triangle shapes above the bars/candles, which violate the rules. Colors can be changed in settings.
🎯 ––––WHAT IT DOES––––
The script monitors and signals three critical phases in stock holding based on the Relative Strength line and moving averages.
👉First, the "Quick Break" indicates a potential short-term weakening in trend strength.
👉Following this, the "Quicksand" condition suggests a further decline in relative performance, prompting a more defensive stance.
👉Finally, the "Grateful Dead Break" signals a more significant trend reversal, potentially warranting the liquidation of the position.
These signals are visualized as shapes plotted on the chart for easy recognition.
🛠️ ––––HOW TO USE IT––––
To use this indicator, traders should input their desired index for RS comparison and adjust the moving average lengths and types according to their strategy. The default settings are an 8-period fast moving average and a 21-period slow moving average, but these can be modified. The script generates alerts for each of the three conditions - Quick Break, Quicksand, and Grateful Dead Break - aiding traders in decision-making. It is crucial to note that this tool is designed for managing a core position in a winning stock and should be used in conjunction with a comprehensive trading strategy. Testing and understanding the pros and cons of this method before implementation is advised, as emphasized by Mike Webster.

RSI 11 IndicatorThis script explains how RSI can be used to catch market moves in trend, reversal or sideways market.
What is RSI indicator:-
RSI is a momentum oscillator which measures the speed and change of price movements. RSI moves up and down (oscillates) between ZERO and 100. Generally RSI above 70 is considered overbought and below 30 is considered oversold. Some traders may use a setting of 20 and 80 for oversold and overbought conditions respectively. However this may reduce the number of signals. You can also use RSI to identify divergences, strength, reversals, general trend etc.
Calculation:-
There are three basic components in the RSI - Avg Gain, Avg Loss & RS.
Avg Gain = Average of Upward Price Change
Avg Loss = Average of Downward Price Change
RS = (Avg Gain)/(Avg Loss)
RSI = 100 – (100 / (1 +RS ))
First Calculation:-
RSI calculation is based on default 14 periods.
Average gain and Average loss are simple 14 period averages.
Average Loss equals the sum of the losses divided by 14 for the first calculation.
Average Gain equals the sum of the Gains divided by 14 for the first calculation.
First Average Gain = Sum of Gains over the past 14 periods / 14.
First Average Loss = Sum of Losses over the past 14 periods / 14.
The formula uses a positive value for the average loss.
RS values are smoothed after the first calculation.
Second Calculation:-
Subsequent calculations multiply the prior value by 13, add the most recent value, and divide the total by 14.
Average Gain = / 14.
Average Loss = / 14.
if
Average Loss = 0, RSI = 100 (means there were no losses to measure).
Average Gain = 0, RSI = 0 (means there were no gains to measure).
Logic of this indicator:-
RSI is an oscillator that fluctuates between zero and 100 which makes it easy to use for many traders.
Its easy to identify extremes because RSI is range-bound.
But remember that RSI works best in range bound market and is less trustworthy in trending markets.
A new trader need to be cautious because during strong trends in the market/security, RSI may remain in overbought or oversold for extended periods.
Chart Timeframe:-
RSI indicator works well on all timeframes.
Timeframe depends on which strategy or settings are you using.
Generally a lower timeframe like 1 min, 3 min, 5 min, 15 min, 30 min, 1 Hr etc is used for intraday trades or short duration trades
and higher timeframes like 1 day, 1 week, 1 month are used for positional or long term trades.
Please Read the Idea "Mastering RSI with 11 Strategies" to understand this indicator better.
Indicator 1
Basis Strategy of Overbought and Oversold
Usually an asset with RSI reading of 70 or above indicates a bullish and an overbought situation.
overbought can be seen as trading at a higher price than it should.
traders may expect a price correction or trend reversal and sell the security.
but RSI indicator can stay in the overbought for a long time when the stock is in uptrend - This may trap an immature trader.
an Immature trader will enter a sell position when RSI become overbought (70), whereas a mature trader will enter sell position when RSI line crosses below the overbought line (70).
An asset with RSI reading of 30 or below indicates a bearish and an oversold condition.
oversold can be seen as trading at a lower price than it should.
traders may expect a price correction or trend reversal and buy the security.
but RSI indicator can stay in the oversold for a long time when the stock is in downtrend - This may trap an immature trader.
an Immature trader will enter a buy position when RSI become oversold (30), whereas a mature trader will enter buy position when RSI line crosses above the oversold line (30).
Center dotted Mid line is RSI 50.
Chart RSI is shown in yellow colour.
Red shaded area above the red horizontal line shows the stock or security has entered overbought condition. "R" signal in red shows a likely downside reversal, means it may be a likely Selling opportunity.
Green shaded area below the green horizontal line shows the stock or security has entered oversold condition. "R" signal in green shows a likely upside reversal, means it may be a likely Buying opportunity.
Note:-
so its better to wait for reversal signal.
traders may use 20 instead of 30 as oversold level and 80 instead of 70 as overbought level.
new traders may learn to use the indicator as per the prevailing trend to get better results.
false signals may be avoided by using bullish signals in bullish trend and bearish signals in bearish trend.
Indicator 2
RSI Strength Crossing 50
RSI crossing centreline 50 in the below chart showing strength and buy/sell signal.
Centre line is at RSI 50.
if RSI is above 50 its considered bullish trend. (increasing strength)
if RSI is below 50 its considered bearish trend. (decreasing strength)
RSI crossing centre line (50) upside may be a buy signal.
RSI crossing centre line (50) downside may be a sell signal.
"B" signal in green colour shows that RSI is crossing above Mid 50 horizontal line, which may be a likely Buy signal.
"S" signal in red colour shows that RSI is crossing below Mid 50 horizontal line, which may be a likely Sell signal.
Indicator 3
RSI 40 and RSI 60 Support and Resistance
RSI 40 acting as support in the below chart
In an uptrend RSI tends to remain in the 40 to 90 range with 40 as support (buying opportunity at support).
RSI 60 acting as resistance in the below chart
In a downtrend RSI tends to remain in 10 to 60 range with 60 as resistance (selling opportunity at resistance).
"40" signal in green colour shows that RSI is crossing above 40 horizontal line, which may be a likely Support in making and a Buy signal.
"60" signal in red colour shows that RSI is crossing below 60 horizontal line, which may be a likely Resistance in making and a Sell signal.
Note:-
These ranges may change depending on RSI settings and change in the market trend.
Indicator 4
RSI Divergence
Below chart shows a simple example of Bullish Divergence and Bearish Divergence.
An RSI divergence occurs when price moves in the opposite direction of the RSI.
A bullish divergence is when price is falling but RSI is rising. which means RSI making higher lows and price making lower lows (buy signal).
A bearish divergence is when price is rising but RSI is falling. which means RSI making lower high and price making higher highs (sell signal).
Divergences are more strong when appear in an overbought or oversold condition.
There may be many false signals during a strong uptrend or strong downtrend.
In a strong uptrend, RSI may show many false bearish divergences before finally reversing down.
same way in a strong downtrend, RSI may show many false bullish divergences before finally reversing up.
"Bull Div" signal along with divergence line in green colour shows Bullish Divergence, which may be a likely Buy signal.
"Bear Div" signal along with divergence line in red colour shows Bearish Divergence, which may be a likely Sell signal.
Indicator 5
Double Top & Double Bottom
Double Bottom = RSI goes below oversold (30). RSI comes back above 30. RSI falls back again towards 30 and again rise making a Double bottom. its a signal of buying and likely upside reversal.
Double Top = RSI goes above overbought (70). RSI comes back below 70. RSI rises back again towards 70 and again fall making a Double top. its a signal of selling and likely downside reversal.
Double Bottom is shown with Green Dashed line joining two low's of RSI indicating a likely Buy Signal.
Double Top is shown with Red Dashed line joining two High's of RSI indicating a likely Sell Signal.
Indicator 6
Trendline Support and Resistance
Below chart shows RSI Trendline Resistance and Support
RSI resistance trendline = Connect three or more points on the RSI line as it falls to draw a RSI downtrend line (RSI resistance trendline).
Everytime it takes resistance from a RSI downtrend line its a selling opportunity.
RSI support trendline = Connect three or more points on the RSI line as it rises to draw a RSI uptrend line (RSI support trendline).
Everytime it takes support on a RSI uptrend line its a buying opportunity.
RSI Resistance trendline shown in Red colour indicating a likely fall again after rejection from this Red trendline till the time RSI breaks above it to change the trend from Bearsih to Bullish.
RSI support trendline shown in Green colour indicating a likely Rise again after support from this Green trendline till the time RSI breaks below it to change the trend from Bullish to Bearish.
Indicator 7
Trendline Breakout and Breakdown
Below chart shows RSI Trendline Breakout and Breakdown
RSI resistance trendline Breakout = Connect three or more points on the RSI line as it falls to draw a RSI downtrend line (RSI resistance trendline).
Whenever it breakout above RSI resistance trendline its a buying opportunity.
RSI support trendline Breakdown = Connect three or more points on the RSI line as it rises to draw a RSI uptrend line (RSI support trendline).
Whenever it breakdown below RSI support trendline its a selling opportunity.
Note:-
Correlate both the RSI and the closing price to ensure proper breakout or breakdown.
Challenge is to correctly identify if a breakout or breakdown is sustainable or its a false signal.
Indicator 8
RSI Crossover same timeframe
RSI with two different RSI length crossing each other on same timeframe.
when lower RSI length crossing above higher RSI length its a buy signal.
when lower RSI length crossing below higher RSI length its a sell signal.
for example RSI with length 7 & length 14 on 15 Minutes timeframe.
Green Cross shows that Fast RSI is crossing above Slow RSI on the same timeframe with different RSI length Settings, which means it may be a likely Buy Signal.
Red Cross shows that Fast RSI is crossing below Slow RSI on the same timeframe with different RSI length Settings, which means it may be a likely Sell Signal.
Indicator 9
RSI Crossover Multi timeframe
RSI with same RSI length but on two different timeframes crossing each.
when lower timeframe RSI crossing above higher timeframe RSI its a buy signal.
when lower timeframe RSI crossing below higher timeframe RSI its a sell signal.
for example RSI with length 14 on 5 Minutes and 1 Hr timeframes.
Green Cross shows that Lower Timeframe RSI is crossing above Higher Timeframe RSI with same RSI length Settings, which means it may be a likely Buy Signal.
Red Cross shows that Lower Timeframe RSI is crossing below Higher Timeframe RSI with same RSI length Settings, which means it may be a likely Sell Signal.
Indicator 10
RSI EMA/WMA/SMA Crossover
when RSI crossing above EMA/WMA/SMA its a buy signal.
when RSI crossing below EMA/WMA/SMA its a sell signal.
Green Circle shows that RSI is crossing above EMA/WMA/SMA etc, which means it may be a likely Buy Signal.
Red Circle shows that RSI is crossing below EMA/WMA/SMA etc, which means it may be a likely Sell Signal.
Indicator 11
RSI with Bollinger bands
Bollinger bands and RSI complimenting each other and giving a Buy and Sell signal in below chart
if a security price reaches upper band of a Bollinger Band channel and also the RSI is above 70 (overbought), a trader can look for selling opportunities (reversal) (sell).
but in case price reaches upper band of a Bollinger Band channel but RSI is not above 70 (overbought), there may be chance that security remains in an uptrend, so a trader may wait before entering a sell position.
if a security price reaches lower band of a Bollinger Band channel and also the RSI is below 30 (oversold), a trader can look for buying opportunities (reversal) (buy).
but in case price reaches lower band of a Bollinger Band channel but RSI is not below 30 (oversold), there may be chance that security remains in an downtrend, so a trader may wait before entering a buy position.
so bollinger band with RSI can give a double confirmation on a reversal.
Buy Signal = If the RSI is below Green Horizontal line (Oversold zone) and also below Lower Bollinger Band it indicates that an upside reversal may come, which means that it may be a likely Buy Signal.
Sell Signal = If the RSI is above Red Horizontal line (Overbought zone) and also above Upper Bollinger Band it indicates that an Downside reversal may come, which means that it may be a likely Sell Signal.
Special Thanks to //© HoanGhetti for RSI Trendlines.
Limitations of the RSI:-
RSI works best in range bound market and is less trustworthy in trending markets.
So new traders may get trapped in an uptrend or a downtrend if they forget to see the overall long term trend of that security.
Traders should set stop loss and take profit levels as per risk reward ratio.
Note:
Don't confuse RSI and relative strength. RSI is changes in the price momentum of a security.
whereas relative strength compares the price performance of two or more securities.
Like other technical indicators, RSI also is not a holy grail. It can only assist you in building a good strategy. You can only succeed with proper position sizing, risk management and following correct trading Psychology (No overtrade, No greed, No revenge trade etc).
THIS INDICATOR OF RSI IS FOR EDUCATIONAL PURPOSE AND PAPER TRADING ONLY. YOU MAY PAPER TRADE TO GAIN CONFIDENCE AND BUILD FURTHER ON THESE. PLEASE CONSULT YOUR FINANCIAL ADVISOR BEFORE INVESTING. WE ARE NOT SEBI REGISTERED.
Hope you all like it
happy learning.

ROCkin RSIROCkin RSI Indicator
Overview
The "ROCkin RSI" indicator combines the traditional Relative Strength Index (RSI) with an innovative approach using the Rate of Change (ROC) to offer a new way to visualize and interpret market momentum. By averaging the slope of the RSI over time and allowing for different types of moving averages, this indicator aims to help traders identify trending and reversal patterns more efficiently.
Features
RSI Calculations: The core of the indicator is based on the standard Relative Strength Index, an oscillator that measures the speed and change of price movements. The RSI oscillates between 0 and 100 and is usually used to identify overbought or oversold conditions.
Rate of Change of Price (ROC): Instead of simply plotting the RSI, this indicator calculates the Rate of Change of the closing price, essentially looking at how steep the RSI curve is over a user-defined period.
Smoothing: To reduce noise and make the curve smoother, the slope of the RSI is averaged over a given number of periods, which can either be a Simple Moving Average (SMA) or an Exponential Moving Average (EMA).
Column Plots: The smoothed RSI slope is plotted as columns, where the color of the columns (red or green) indicates whether the slope is positive or negative.
Optional RSI Moving Average: The indicator also offers an optional feature to plot a moving average of the smoothed RSI slope, aiding in trend identification.
Inputs
RSI Periods: The number of periods used to calculate the RSI.
Slope Periods: The number of periods used for calculating the Rate of Change.
Average Periods: The number of periods used for smoothing the RSI slope.
Type of Average: Choose between EMA (Exponential Moving Average) and SMA (Simple Moving Average) for smoothing.
Show RSI Moving Average: Toggle this to either show or hide the moving average of the smoothed RSI slope.
Moving Average Period: The period used for calculating the RSI Moving Average.
Moving Average Type: Choose between EMA and SMA for the RSI Moving Average.
How to Interpret
Positive Slope (Red Columns): Indicates upward momentum in the RSI, which may imply a bullish trend.
Negative Slope (Green Columns): Indicates downward momentum in the RSI, suggesting a possible bearish trend.
RSI Moving Average: Acts as a signal line to confirm the trend. When the smoothed RSI slope is above its moving average, it confirms the bullish trend, and when it's below, it confirms the bearish trend.
Practical Use
Entry/Exit Signals: Consider entering a long position when the columns of the green histogram cross above the moving average. Conversely, consider entering a short position when the columns cross under when red. The higher the columns the more likely the trade will be a good one.
Fine-Tuning and Optimization
It's crucial to understand that the default settings might not be optimal for all trading scenarios. The effectiveness of the ROCkin RSI indicator can vary based on the asset you're trading, the market conditions, and your trading style. Therefore, it's highly recommended to play with the settings and study the historical performance on the chart to grasp how the indicator behaves.
By experimenting with different periods for RSI, the Rate of Change, and the moving averages, you can tailor the indicator to better suit your needs. Studying how the indicator would have performed in the past can help you understand its potential strengths and weaknesses. Once you've got a feel for how it operates, you can then optimize the settings to align with your trading strategy and risk tolerance.

Price Strength Index + RSI Buy/Sell ZonesThe Price Strength Index + RSI Buy/Sell Zones indicator is a technical analysis tool designed to evaluate the strength of a financial asset's price movement by comparing it with a series of Volume Weighted Moving Averages (VWMAs) of different lengths calculated from historical data.
Hypothesis :
The core hypothesis behind this indicator is that assessing the relationship between the current price and a range of VWMAs with varying lengths can provide valuable insights into the strength and direction of a price trend. Additionally, it incorporates Relative Strength Index (RSI) conditions to further refine potential buy and sell signals.
How It Works :
Multiple VWMA Calculation: The indicator calculates multiple VWMAs, each with a different length, using historical price data and volume. These VWMAs represent weighted moving averages over various periods, helping to capture different aspects of the price trend.
Comparison with Current Price : For each of these VWMAs, the indicator compares the current bar's price with the VWMA value. This comparison is crucial in understanding how the current price relates to historical averages, shedding light on the strength and direction of the prevailing trend.
SMA of Percentage Above VWMA : The indicator calculates the Simple Moving Average (SMA) of the percentage of prices above the various VWMAs over a specified period. This moving average smoothens out the percentage data, providing a clearer trend signal.
Buy and Sell Zones : User-defined upper and lower thresholds for the percentage of prices above the VWMAs are used to define buy and sell zones. When the percentage falls below the lower threshold, it signals a potential buy zone, suggesting a weakening trend. Conversely, when it exceeds the upper threshold, it signifies a potential sell zone, indicating a strengthening trend.
RSI Integration : The RSI is calculated for the selected price source with a specified length. When the SMA of the percentage above VWMAs falls within the buy zone and the RSI is below the lower RSI threshold, it indicates an oversold condition, potentially signaling a buy opportunity. Conversely, when the SMA falls within the sell zone and the RSI is above the upper RSI threshold, it suggests an overbought condition, possibly signaling a sell opportunity.
Color Coding : The indicator employs color-coding to visually represent the buy and sell zones, as well as extreme RSI conditions. Green color denotes the buy zone, red represents the sell zone, and orange lines indicate the median and potential reversal points.
In summary, the Price Strength Index + RSI Buy/Sell Zones indicator leverages multiple VWMAs of different lengths to assess the relationship between current prices and historical moving averages. This comprehensive analysis, coupled with RSI conditions, aids traders in identifying potential buy and sell zones, as well as extreme RSI points within those zones, enhancing the evaluation of price strength and potential trend reversals.

NPM Rsi DivergenceNPM RSI Divergence Indicator
The NPM RSI Divergence Indicator is a closed-source tool designed to help traders identify potential reversals and high-probability trade setups using divergence between price action and the Relative Strength Index (RSI). It highlights areas where momentum is weakening or strengthening, giving traders early signals of potential trend changes.
What it does
Detects divergences between RSI and price movement, indicating potential trend reversals or continuation.
Shows the strength or reliability of each divergence signal to help traders gauge probability.
Plots visual markers directly on the chart for easier recognition of potential setups.
Helps traders spot early exhaustion points in trends before price reverses or continues strongly.
How it works (concept-level)
Compares price highs/lows with RSI highs/lows to detect hidden or regular divergences.
Applies adaptive filtering to reduce false signals in choppy or low-volatility markets.
Aggregates divergence signals into clear visual markers and strength indicators.
Incorporates momentum context to highlight divergences that are more likely to produce actionable moves.
How to use it
1. Apply the indicator to your chosen symbol and timeframe.
2. Observe divergence markers and their strength indicators on the chart.
3. Confirm potential trade opportunities by considering trend direction and market context.
4. Use divergence signals to assist with trade entry, exit, or risk management decisions.
Alerts
Optionally set alerts when divergence signals appear or when the strength indicator exceeds a user-defined threshold.
Notes
Suitable for multiple markets, including forex, indices, crypto, and equities.
Can be used on intraday or swing trading timeframes depending on your trading strategy.
⚠️ Disclaimer: This script is for educational purposes only and is not financial advice. Trading involves risk, and you can lose money. Always test strategies on a demo account and practice proper risk management.

RSI Dynamic Bands█ OVERVIEW
The "RSI Dynamic Bands" indicator is a variant of the Relative Strength Index (RSI) oscillator that brings its signals directly onto the price chart. It displays dynamic bands around the price, adjusted based on RSI levels, enabling easy identification of potential overbought or oversold conditions. The indicator also integrates a multi-timeframe RSI table, facilitating the analysis of trend strength across different timeframes.
█ CONCEPTS
The "RSI Dynamic Bands" indicator is designed to simplify the interpretation of price levels in the context of support and resistance zones, which can be correlated with other technical indicators and RSI values. Since the price itself does not display RSI values, a table showing RSI for four selected timeframes has been added, allowing traders to quickly assess trend strength across different time intervals. The most effective approach is to combine the indicator with other technical analysis tools, such as Fibonacci levels or pivot points, to confirm signals when the price approaches the bands and RSI values indicate a potential reversal.
Band Calculation
The bands are calculated based on the current closing price and RSI values, incorporating dynamic scaling to better adapt to market conditions. The formulas for the bands are as follows:
• Upper Band: close + (rsiUpper - rsi) * scaleFactor, where rsiUpper is the upper RSI level (default: 70), and scaleFactor accounts for market volatility.
• Lower Band: close + (rsiLower - rsi) * scaleFactor, where rsiLower is the lower RSI level (default: 30).
• Midline: The arithmetic average of the upper and lower bands: (upperBand + lowerBand) / 2.
Why Scaling? Without scaling, the bands would be chaotic and jagged, making them difficult to interpret. Scaling smooths the bands, making them wider during periods of high volatility and narrower during consolidation, better reflecting potential support and resistance levels.
Indicator Features
• Dynamic Price Bands: The bands adapt to market conditions, facilitating the identification of key price levels.
• Multi-Timeframe RSI Table: Displays RSI values for four selected timeframes (default: 15m, 1h, 4h, Daily), enabling comparison of trend strength across different perspectives.
• Style Customization: Users can adjust band colors, line thickness, and toggle the visibility of bands, fills, and the table.
How to Set Up the Indicator
1 — Add the "RSI Dynamic Bands" indicator to your TradingView chart.
2 — Configure parameters in the settings, such as RSI length, upper/lower levels, and scaling multiplier, to match your trading style.
3 — Enable or disable the display of bands, fills, or the RSI table based on your needs.
4 — Adjust band and table colors in the input section and line thickness in the "Style" section to better align the indicator with your chart.
█ OTHER SECTIONS
FEATURES
• RSI Length: The period for calculating RSI (default: 14).
• RSI Levels: Thresholds for overbought (default: 70) and oversold (default: 30).
• Scaling Multiplier: Adjusts bands based on market volatility (default: 0.15).
• Table Timeframes: Select four timeframes for the RSI table (default: 15m, 1h, 4h, Daily).
• Style Options: Customize band colors, fills, table, and line thickness.
HOW TO USE
Add the indicator to your chart, configure the parameters, and observe price interactions with the bands to identify potential entry and exit points. The RSI table allows you to compare RSI values across different timeframes, aiding in trading decisions. The most effective approach is to combine the indicator with other technical analysis tools, such as Fibonacci levels or pivot points, to confirm signals when the price approaches the bands and RSI values indicate a potential reversal.
Trading Strategies:
• Scalping: Use lower timeframes (e.g., 5m, 15m) in the RSI table to quickly identify short-term lows and highs. Wait for the price to approach the lower band in the RSI oversold zone, with RSI on lower timeframes starting to rise, and other tools, such as Fibonacci levels (e.g., 38.2%) or pivot points, confirming support.
• Medium-Term Trading: Focus on 1h and 4h timeframes. Look for confirmation of a low on a lower timeframe (e.g., 1h), where RSI indicates oversold conditions or starts rising, then check if RSI on a higher timeframe (e.g., 4h) confirms the trend. Confirmation from other tools, such as a Fibonacci level (e.g., 50%) or pivot point near the bands, strengthens the signal.
• Long-Term Trading: Use Daily and higher timeframes (e.g., Weekly). Wait for all relevant timeframes to confirm a low (e.g., RSI near oversold and price at the lower band), with lower timeframes (e.g., 4h) showing rising RSI. Other tools, such as Fibonacci levels (e.g., 61.8%) or pivot points near the bands, can further confirm a trend reversal signal.

US Macro Cycle (Z-Score Model)US Macro Cycle (Z-Score Model)
This indicator tracks the US economic cycle in real time using a weighted composite of seven macro and market-based indicators, each converted into a rolling Z-score for comparability. The model identifies the current phase of the cycle — Expansion, Peak, Contraction, or Recovery — and suggests sector tilts based on historical performance in each phase.
Core Components:
Yield Curve (10y–2y): Positive & steepening = growth; inverted = slowdown risk.
Credit Spreads (HYG/LQD): Tightening = risk-on; widening = risk-off.
Sector Leadership (Cyclicals vs. Defensives): Measures market leadership regime.
Copper/Gold Ratio: Higher copper = growth signal; higher gold = defensive.
SPY vs. 200-day MA: Equity trend strength.
SPY/IEF Ratio: Stocks vs. bonds relative strength.
VIX (Inverted): Low/falling volatility = supportive; high/rising = risk-off.
Methodology:
Each series is transformed into a rolling Z-score over the selected lookback period (optionally using median/MAD for robustness and winsorization to clip outliers).
Z-scores are combined using user-defined weights and normalized.
The smoothed composite is compared against phase thresholds to classify the macro environment.
Features:
Customizable Weights: Emphasize the indicators most relevant to your strategy.
Adjustable Thresholds: Fine-tune cycle phase definitions.
Background Coloring: Visual cue for the current phase.
Summary Table: Displays composite Z, confidence %, and individual Z-scores.
Alerts: Trigger when the phase changes, with details on the composite score and recommended tilt.
Use Cases:
Align sector rotation or relative strength strategies with the macro backdrop.
Identify favorable or defensive phases for tactical allocation.
Monitor macro turning points to manage portfolio risk.
It's doesn't fill nan gaps so there is quite a bit of zeroes, non-repainting.

RAMS TrapMaster ConfluenceOverview:
The TrapMaster Confluence indicator is a tactical multi-factor confirmation system designed to identify high-probability intraday and swing trade setups. It aligns multiple technical signals—momentum, trend, volume, and price action—to generate a clear bias score. By requiring confluence across several dimensions, it filters out weak or noisy signals and highlights trades with broader technical agreement. This tool is tailored for semi-advanced retail traders across equities, futures, and crypto who seek objective, structured confirmations before entering a position.
Confluence Components:
RSI (Relative Strength Index):
Evaluates momentum strength and trend bias. The script dynamically checks for crossovers at the 50 midline and extreme overbought/oversold zones to determine directional pressure.
MACD (Moving Average Convergence Divergence):
Detects momentum shifts using signal line crossovers and MACD histogram polarity. The script uses MACD direction and histogram flips to contribute to bullish or bearish pressure.
SMA 5 vs. SMA 20:
Captures short-term trend shifts via fast–slow moving average crossovers. A rising 5-SMA over a falling 20-SMA supports a bullish thesis and vice versa.
SMA 50 vs. SMA 200:
Used to confirm longer-term trend bias (e.g. golden cross or death cross) and add weight to the broader market structure.
SMA 5 Trend Direction:
Assesses immediate trend slope. An upward or downward slope of the 5-SMA confirms recent price acceleration or deceleration.
Volume Spike:
Flags high-volume price moves, helping validate whether momentum is supported by institutional participation or liquidity interest.
Rising Volume Bars:
Confirms directional strength through consistent increases in volume during trends. Sustained rising volume suggests growing conviction.
VWAP (Volume-Weighted Average Price):
Anchors price to institutional average cost per session. Price above VWAP typically indicates bullish sentiment; below signals bearish sentiment.
Candlestick Confirmation:
Confirms signals using recent price action (e.g. engulfing candles, breakouts with volume). Adds an extra layer of price behavior validation.
Contrarian Mode (Optional):
This feature flips the typical logic to catch high-probability reversal zones. When many signals align in one direction, contrarian mode allows the user to search for exhaustion points in sentiment or momentum, potentially capturing mean reversions.
Each confluence factor contributes a vote to a composite bias count. Users define a threshold (e.g., 4 out of 6 conditions) to trigger a signal. The indicator does not rely on any one signal, but instead rewards alignment across multiple technical aspects.
Signal Generation & Alerts:
When the defined confluence threshold is met, a signal label appears on the chart with directional context (long or short). Alerts can be tied to these signals, allowing the user to be notified in real time when actionable setups occur. The system supports “next candle confirmation,” which delays signal printing until the bar closes, minimizing premature alerts. All labels are limited to the most recent few to reduce chart clutter.
Dashboard Overview:
The optional real-time dashboard shows which confluence components are active on the current candle. This visual panel is customizable, updating dynamically and remaining hidden when no conditions are met. It includes:
Each factor with active/inactive status
Current bullish and bearish score counts
Real-time snapshot of bias development
Customization & Controls:
All components can be toggled on or off. Traders can choose to require stricter or looser confirmation thresholds. Label visibility, signal timing, and dashboard position/size are fully adjustable. This allows the indicator to adapt across timeframes and trading styles — whether scalping or swing trading.
Suggested Use with Trendlines and support and resistance:
TrapMaster becomes significantly more powerful when used alongside manual or automated support/resistance and trendline analysis. Confluence signals occurring near:
major support zones,
resistance levels,
trendline retests.
Fibonacci retracements,
help validate the price’s reaction to those areas. Traders can pre-mark key price zones, then use TrapMaster to confirm entries as momentum builds at those levels. This strengthens conviction and supports timing decisions when structure and indicators align.
Why It’s Different:
Most scripts offer a single signal or simplistic crossover logic. TrapMaster offers multi-dimensional logic that evaluates a comprehensive set of confluence factors—each customizable—with real-time logic that updates on every bar. The built-in dashboard provides a highly readable tactical summary. Its optional contrarian bias engine, dashboard visuals, factor-level customization, and risk-filtering logic (e.g. delayed confirmation and volume context) make it a flexible and advanced system not commonly found in traditional retail indicators.
Disclaimers:
This tool is for educational and analytical use only. It is not intended as trading or financial advice. All trading carries risk, and past performance is not indicative of future results. Always use proper risk management and conduct your own independent analysis before making trading decisions.
Developed by: TRAPPER-RAMS
Jul 24
Release Notes
This is the official update to RAMS TrapMaster Confluence, featuring massive enhancements across visual clarity, confluence accuracy, and real-time alert precision.
What's New:
Accurate Confluence Dashboard
Triple-row layout: Bullish , Bearish , and clear headers
Bull/Bear condition separation for total clarity
SMA 5/20 & 50/200 cross states tracked and displayed
Fully Integrated Alerts
Alerts for 5/20 and 50/200 SMA crosses
Bullish 💸 and Bearish 💰 confluence entry alerts
Instant trigger-ready setup
Visual Label Overhaul
💸 = Buy Signal (normal mode)
💰 = Sell Signal (normal mode)
🧨 = Contrarian Bull Flip
💣 = Contrarian Bear Flip
Cross labels show exact bar: "5/20 X", "50/200 X"
CoolDown & Memory-Efficient Label Logic
• Configurable label cooldown per N bars
• Old signals auto-deleted to prevent overflow
Use Cases:
This update is ideal for traders looking for precision entry timing, while understanding the full bull/bear backdrop in real-time.

Advanced Market Dashboard - Compact Atr,bb,Dcng%,RSI,ADX,vwapDescription of the Advanced Market Dashboard Indicator:
This Pine Script indicator is a comprehensive technical dashboard designed for use with TradingView. The indicator displays key market metrics, price changes, and popular technical indicators directly on the chart in real-time.
Features of the Indicator
1. Price and Price Change
Current Price: Displays the current closing price of the symbol (e.g., $100.50).
Change in Price:
Value Change: Displays how much the price has changed compared to the previous period (e.g., "+$2.50").
Percentage Change: Shows the percentage difference between the previous period's close and the current price (e.g., "+2.5%").
Period Selection: Allows you to choose the time period for this change (e.g., 1 minute, daily, weekly, or monthly).
Example:
Current Price = $150.50
Change = +$1.25 (+0.83%)
2. VWAP (Volume Weighted Average Price)
VWAP represents the average price of a security weighted by volume. It’s widely used by intraday traders to gauge where the market price is relative to typical buying/selling levels.
Plot of VWAP is included on the chart for easy visualization.
3. ATR (Average True Range)
Displays ATR (21 period), an indicator commonly used for understanding price volatility.
Higher ATR values indicate higher volatility, while lower ATR values suggest lower volatility.
4. RSI (Relative Strength Index)
Displays RSI (21 period):
RSI is a popular oscillator that measures price momentum strength.
Ranges from 0 to 100:
Values above 70 indicate overbought conditions.
Values below 30 indicate oversold conditions.
Includes visual overbought/oversold lines (70 and 30) plotted directly on the chart.
5. ADX (Average Directional Index)
Displays ADX (14 period), which measures the strength of a trend:
ADX above 25: Indicates a strong trend.
ADX below 25: Indicates weak or no trend.
Includes a reference line (25) plotted on the chart to help interpret trend direction.
6. Bollinger Bands
Displays:
Upper Band: Basis + (StdDev × multiplier)
Lower Band: Basis - (StdDev × multiplier)
Middle Line: Simple Moving Average (SMA)
Bollinger Bands help identify volatility and potential buy/sell opportunities:
Price near the upper band: Indicates overbought conditions.
Price near the lower band: Indicates oversold conditions.
Plots all three bands directly on the chart for visual guidance.
Compact Table
The indicator organizes all data into a clean, compact table in the top-right corner of the chart. Each metric is displayed alongside its value:
Symbol Name and Price
Example:
Price Change
Example:
VWAP
Example:
ATR
Example:
RSI
Example:
ADX
Example:
Bollinger Upper Band
Example:
Bollinger Lower Band
Example:
Visual Plots on Chart
In addition to the table display, the following indicators are visually plotted on the chart for easy reference:
VWAP
Bollinger Bands (Upper, Lower, and Middle)
RSI Overbought/oversold levels
ADX Trend strength reference line (value = 25)
Customizable Settings
ATR Length: Default = 21.
RSI Length: Default = 21.
ADX Length: Default = 14.
Bollinger Band Parameters:
Length: Default = 20.
Standard Deviation: Default = 2.0.
Price Change Periods: Choose between:
1-minute
Daily
Weekly
Monthly.
How to Use
Add the script to your TradingView chart.
In the indicator settings, configure lengths and periods according to your preference.
Use the compact table for real-time metrics and refer to the chart plots for visual insights.
Who Should Use This Indicator?
This indicator is ideal for:
Day Traders: Use VWAP, ATR, RSI, and Bollinger Bands for intraday price action.
Trend Followers: Use ADX to confirm trending markets.
Technical Analysts: Quickly access multiple technical metrics without adding multiple indicators.
Swing Traders: Use Bollinger Bands and RSI for spotting overbought/oversold conditions.
Why This Indicator Stands Out?
Multiple Indicators in One: Eliminates the need to add separate indicators for VWAP, ATR, RSI, ADX, Bollinger Bands, and price changes.
Compact Design: Data displayed neatly in a table to reduce chart clutter.
Customizability: Users can fine-tune settings for their specific trading style.
Real-time Updates: Values are recalculated dynamically on each new bar, ensuring accuracy.
Limitations
This indicator is solely designed for informational purposes and does not provide buy/sell signals automatically.
The accuracy of Bollinger Bands, RSI, VWAP, etc., depends on the selected input parameters.
The price change feature may not work for extended periods in tick charts or non-standard timeframes.
Conclusion
This Advanced Market Dashboard is a powerful all-in-one tool for traders and analysts who require real-time market metrics. It combines essential indicators while maintaining a user-friendly interface for both novice and professional traders.

RSI-Two.4This looks like a detailed breakdown of a custom trading indicator based on the RSI (Relative Strength Index). It integrates various sub-indicators and visual analysis tools to precisely identify market strength and trend reversal signals.
Here is the English version of the provided text.
Overview
This indicator is designed to precisely identify market strength and trend reversal signals by integrating various sub-indicators and visual analysis tools centered around the RSI (Relative Strength Index).
On the chart, you can grasp the RSI trend, overbought/oversold zones, divergences, and trend reversal signals all at once, enabling more reliable trading decisions.
Detailed Feature Analysis
1. Basic RSI Calculation and Visualization
RSI Calculation:
Instead of the traditional RSI formula, a smoothed moving average method using ta.rma() is employed to reduce noise and provide a more intuitive RSI value.
Line Color and Display:
The RSI line is displayed in blue (#0B54FE) when the value is below 30, pink (#FC0FC0) when it's above 70, and semi-transparent white otherwise. This provides a clear, intuitive distinction of overbought and oversold zones.
Adjustable Line Thickness:
You can adjust the line thickness for customized chart readability.
2. RSI Candle Chart
Purpose:
The visual flow of the RSI is displayed in a candle chart format, allowing you to grasp the RSI's upward/downward trend at a glance.
Application:
Rising candles are shown in transparent green, while falling candles are shown in transparent red, allowing for an immediate assessment of market strength.
Utility:
This is far more intuitive than a regular RSI line and, when viewed alongside the main candle chart, helps you quickly recognize market turning points.
3. Ichimoku Cloud (RSI-based)
Cloud Concept:
This feature borrows the principles of the traditional Ichimoku Cloud to form an RSI-based cloud.
Leading Spans A and B:
The leading spans are calculated using the RSI's conversion and base lines, visualizing market support and resistance zones.
Colors:
Upward clouds are green, and downward clouds are brown.
How to Use:
Quickly identify bullish/bearish zones based on the cloud's color and position. A breakthrough of the cloud can be used as a strong trend reversal signal.
4. v.h.m. Moving Average Trend Length (Self-Calculated)
Color Change:
The color changes to green when the RSI rises and to pink when it falls, providing an intuitive grasp of the trend's direction.
Expert Tip:
A strong buy signal can be generated when the HMA (Hull Moving Average) turns upward, and a sell signal when it turns downward.
5. Overbought/Oversold Vertical Lines
Levels:
Based on the 70 (overbought) and 30 (oversold) thresholds.
Signals:
When the RSI crosses above 70 or below 30, colored vertical lines appear in the chart's background, quickly signaling an overbought or oversold state.
Expert Application:
Use overbought zones to identify potential selling opportunities and oversold zones to spot potential buying opportunities.
6. Divergence Detection
Function:
The indicator automatically detects bullish and bearish divergences, as well as hidden divergences, by analyzing the difference between price peaks and troughs and the RSI.
Signals:
Labels with "D," circles, or arrows are displayed on the chart to predict a trend reversal or weakening of momentum.
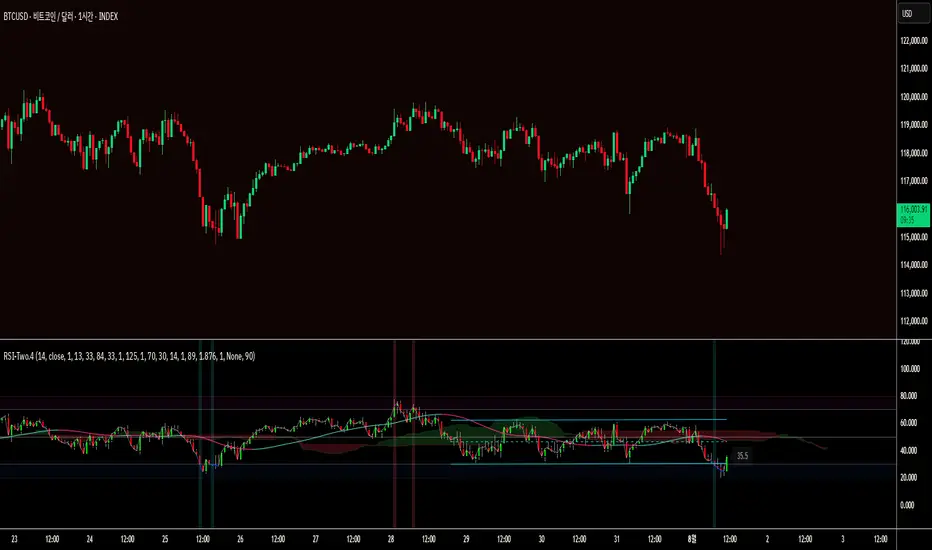
RSI ADX D-LineThe D-Line RSI & ADX indicator combines the Relative Strength Index (RSI) with the Average Directional Index (ADX) to provide traders with a dual perspective on market momentum and trend strength. The RSI (purple line) measures the speed and change of price movements, helping traders identify overbought and oversold conditions. The ADX (red line) gauges the strength of the prevailing trend, assisting traders in filtering out ranging markets and focusing only on strong trends.
This indicator is designed to work on all timeframes and instruments. It helps traders confirm signals: for example, look for entries when RSI shows potential reversals while the ADX confirms the trend’s strength.
Key Features:
Clear RSI and ADX visualization on a single pane
Easily spot trend continuation or reversal setups
Suitable for intraday, swing, or positional trading
How to Use:
When RSI crosses above 70 or below 30, watch for potential reversals.
When ADX is above 20-25, it signals a strong trend; below indicates a weak or ranging market.
Combine RSI overbought/oversold levels with ADX trend confirmation for higher probability trades.
Ideal For:
Traders who want to enhance their decision-making with momentum and trend strength confirmation in one tool.
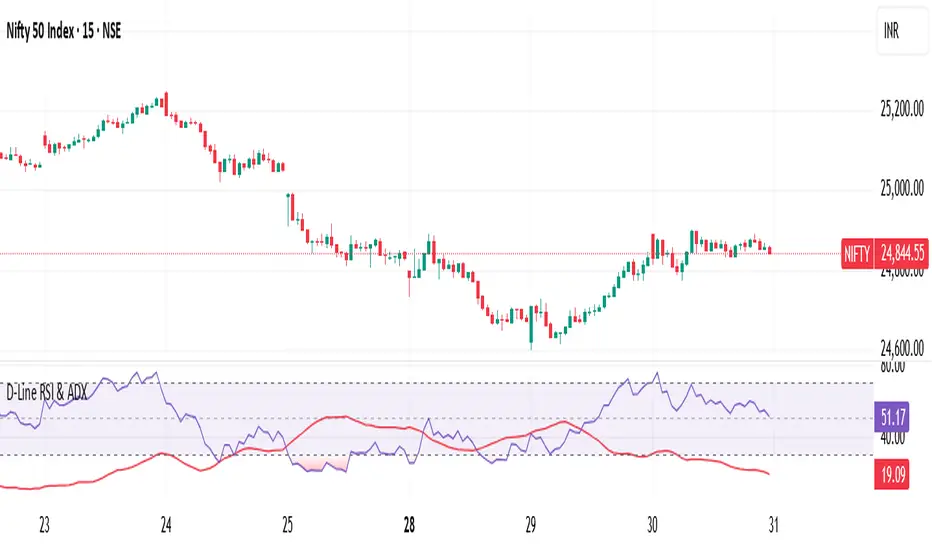
RS Alpha α | viResearchRS Alpha α | viResearch
Conceptual Foundation and Strategy Innovation
RS Alpha α is a dynamic, multi-asset crypto allocation engine designed for precision rotation among trending major assets. Grounded in intra-asset relative strength and enhanced by real-time trend classification, this model moves beyond static filters—adapting allocations to prevailing momentum and volatility regimes.
The strategy is purpose-built to extract tactical alpha in high-beta environments while minimizing whipsaw and drawdowns during uncertain conditions. It achieves this via a systematic, multi-layer filter stack: statistical ranking, trend validation, and risk-adjusted performance scoring.
Technical Architecture and Signal Composition
Relative Strength Matrix:
Assets are scored using a comprehensive 7x7 ratio matrix comparing each asset’s relative momentum against all others. Each row contributes to a cumulative trend score, identifying the top-performing names based on cross-asset strength.
Trend Filters (Multi-Timeframe Adaptive):
Each candidate must pass intra-trend classification (12H, 8H, 4H) and optionally a macro trend regime filter using a user-defined market benchmark (e.g., BTC or ETH on 1D).
Beta & Alpha Filter:
Assets are further screened using custom beta and alpha calculations versus a benchmark. When enabled, only assets showing above-median beta and alpha values are retained.
Optional Risk Ratios:
Sharpe, Sortino, and Omega ratio filters are included (opt-in) for forward testing purposes. These risk metrics refine selection in volatile regimes but are not required for core functionality.
Equity Engine & Allocation Logic:
A real-time system equity curve grows based on rate of change (ROC) from allocated assets, with support for:
100% single asset allocation
50/50 equal split if scores match closely
80/20 weighted allocation based on dominance
Performance Tracking and Alerts
System Equity Visualization: Real-time equity plotted using dynamic coloring tied to the primary asset allocation.
Drawdown Table: Tracks max equity drawdown since a user-defined start date.
Dominant Asset Panel: Displays current allocation format (100%, 80/20, or 50/50) and scoreboard of all considered assets.
Allocation Alerts: Sends alerts when asset rotation occurs, with clear breakdowns of new weightings and symbol changes.
Timeframe Guard: Warns users if running on anything other than the recommended 1D timeframe.
Customization and UX Enhancements
Asset Inclusion Toggle: Easily exclude assets from rotation by changing their input to "USDT".
Background Overlay (Optional): Background color highlights the dominant asset dynamically, with adjustable transparency.
User Switches for All Visual Modules: Toggle individual elements such as alerts, drawdown, dominant tables, or error messages.
Use Case and Target Audience
This tool is ideal for:
Active crypto portfolio managers seeking structured, rule-based asset rotation
Tactical traders who value adaptability and clarity in allocation shifts
Swing traders operating within medium to high-beta environments
It thrives particularly during bull trends, sector rotations, or when paired with macro regime filters like market confidence signals.
Summary
RS Alpha α provides a comprehensive, data-driven framework for crypto asset rotation. It combines statistical rigor with real-time responsiveness, offering high customization and strong risk awareness. Designed for professionals and advanced retail traders alike, it’s both a decision-support tool and a visual performance dashboard.
⚠️ Always validate any strategy with proper backtesting and forward tracking. While RS Alpha α provides robust signal logic, it is one component in a larger portfolio and risk management process.

Multi TF Oscillators Screener [TradingFinder] RSI / ATR / Stoch🔵 Introduction
The oscillator screener is designed to simplify multi-timeframe analysis by allowing traders and analysts to monitor one or multiple symbols across their preferred timeframes—all at the same time. Users can track a single symbol through various timeframes simultaneously or follow multiple symbols in selected intervals. This flexibility makes the tool highly effective for analyzing diverse markets concurrently.
At the core of this screener lie two essential oscillators: RSI (Relative Strength Index) and the Stochastic Oscillator. The RSI measures the speed and magnitude of recent price movements and helps identify overbought or oversold conditions.
It's one of the most reliable indicators for spotting potential reversals. The Stochastic Oscillator, on the other hand, compares the current price to recent highs and lows to detect momentum strength and potential trend shifts. It’s especially effective in identifying divergences and short-term reversal signals.
In addition to these two primary indicators, the screener also displays helpful supplementary data such as the dominant candlestick type (Bullish, Bearish, or Doji), market volatility indicators like ATR and TR, and the four key OHLC prices (Open, High, Low, Close) for each symbol and timeframe. This combination of data gives users a comprehensive technical view and allows for quick, side-by-side comparison of symbols and timeframes.
🔵 How to Use
This tool is built for users who want to view the behavior of a single symbol across several timeframes simultaneously. Instead of jumping between charts, users can quickly grasp the state of a symbol like gold or Bitcoin across the 15-minute, 1-hour, and daily timeframes at a glance. This is particularly useful for traders who rely on multi-timeframe confirmation to strengthen their analysis and decision-making.
The tool also supports simultaneous monitoring of multiple symbols. Users can select and track various assets based on the timeframes that matter most to them. For example, if you’re looking for entry opportunities, the screener allows you to compare setups across several markets side by side—making it easier to choose the most favorable trade. Whether you’re a scalper focused on low timeframes or a swing trader using higher ones, the tool adapts to your workflow.
The screener utilizes the widely-used RSI indicator, which ranges from 0 to 100 and highlights market exhaustion levels. Readings above 70 typically indicate potential pullbacks, while values below 30 may suggest bullish reversals. Viewing RSI across timeframes can reveal meaningful divergences or alignments that improve signal quality.
Another key indicator in the screener is the Stochastic Oscillator, which analyzes the closing price relative to its recent high-low range. When the %K and %D lines converge and cross within the overbought or oversold zones, it often signals a momentum reversal. This oscillator is especially responsive in lower timeframes, making it ideal for spotting quick entries or exits.
Beyond these oscillators, the table includes other valuable data such as candlestick type (bullish, bearish, or doji), volatility measures like ATR and TR, and complete OHLC pricing. This layered approach helps users understand both market momentum and structure at a glance.
Ultimately, this screener allows analysts and traders to gain a full market overview with just one look—empowering faster, more informed, and lower-risk decision-making. It not only saves time but also enhances the precision and clarity of technical analysis.
🔵 Settings
🟣 Display Settings
Table Size : Lets you adjust the table’s visual size with options such as: auto, tiny, small, normal, large, huge.
Table Position : Sets the screen location of the table. Choose from 9 possible positions, combining vertical (top, middle, bottom) and horizontal (left, center, right) alignments.
🟣 Symbol Settings
Each of the 10 symbol slots comes with a full set of customizable parameters :
Enable Symbol : A checkbox to activate or hide each symbol from the table.
Symbol : Define or select the asset (e.g., XAUUSD, BTCUSD, EURUSD, etc.).
Timeframe : Set your desired timeframe for each symbol (e.g., 15, 60, 240, 1D).
RSI Length : Defines the period used in RSI calculation (default is 14).
Stochastic Length : Sets the period for the Stochastic Oscillator.
ATR Length : Sets the length used to calculate the Average True Range, a key volatility metric.
🔵 Conclusion
By combining powerful oscillators like RSI and Stochastic with full customization over symbols and timeframes, this tool provides a fast, flexible solution for technical analysts. Users can instantly monitor one or several assets across multiple timeframes without opening separate charts.
Individual configuration for each symbol, along with the inclusion of key metrics like candlestick type, ATR/TR, and OHLC prices, makes the tool suitable for a wide range of trading styles—from scalping to swing and position trading.
In summary, this screener enables traders to gain a clear, high-level view of various markets in seconds and make quicker, smarter, and lower-risk decisions. It saves time, streamlines analysis, and boosts overall efficiency and confidence in trading strategies.
